
This is the second post in my ongoing research about accessibility statements across the UK. I wanted to know more about how prevalent the adoption of statements was and whether we could then link these findings to other information to create insight.
To be clear, only new websites created or substantially revised since September 2018 needed to be compliant by September 2019. This means that not all websites that I have looked at necessarily need to have a compliant statement by now, but this does also demonstrate the existing accessibility support out there on these websites.
Previous Research
In the original research post which took a snapshot of Accessibility Statements prior to the first deadline for the Public Sector Bodies (Websites and Mobile Applications) Accessibility Regulations 2018 on the 23rd September 2019 I saw a significant way still to go for the UK to see widespread adoption of compliant accessibility statements.
The first version of the dataset was completed on the 16th September 2019 (however data was collected through late August – early September) and covered Local Government (County and District level), Universities, Police Forces and Fire & Rescue Services.
Overall we looked at 369 Local Authorities, 131 Universities, 48 Police Forces and 53 Fire & Rescue Services for a total of 601 organisations.
You can see my original questions and reasoning behind the research and download the Version 1 dataset in the original post.
Latest Updates
The latest version of the dataset was compiled between the 5th and 13th October. The assessment date of each organisation is included in their record. This time I have looked at 1441 organisations covering the following:
- Local Government – 369
- Universities – 131
- Police Forces – 48
- Fire and Rescue Services – 53
- Colleges – 388
- NHS Organisations – 452
Thanks to Ben and James who have helped me update the WebAIM scores for version 2.
Findings
You can download the Version 2 dataset to look at the information gathered for yourself.
I have also created an online map that has been embedded below for those who may wish to view the information with its geographical component.
In comparison to the original dataset in which I broke down compliance into three categories; Compliant, Partial and No Statement, I have further split the categories this time to better group like attempts. In this version Partial Statement has now been split into three categories; Good, Partial, Poor. More information on these categories below:
- Compliant Statement – A statement that includes the required information per the regulations.
- Good Attempt – A statement exists that is useful but does not fulfil all regulatory requirements. These will be almost compliant and/or well meaning in the support that they offer.
- Partial Statement – A statement exists but does not fulfil all regulatory requirements
- Poor Attempt – Poor attempts that provide minimal or no compliance points required. In some cases are misleading to users by referencing outdated standards, laws, or advice.
- No Statement – There is no statement present for the website.
Overall Results
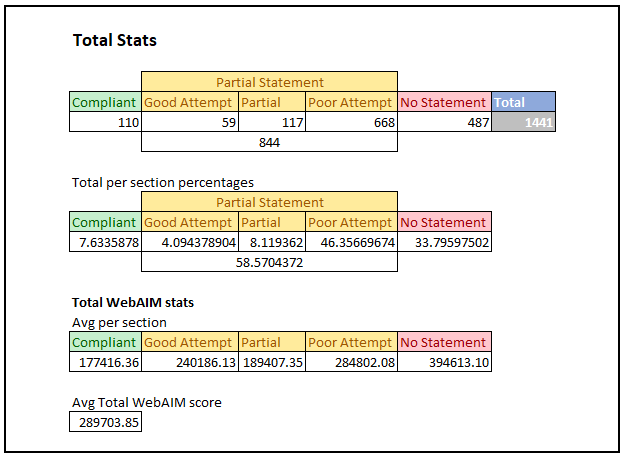
The above tables show statistics for the overall results of the study. The first table shows number of organisations in each category. For the first table the results are:
- Compliant Statements: 110
- Good Attempt: 59
- Partial Statements: 117
- Poor Attempt: 668
- No Statements: 487
- Total: 1441
The second table shows the percentage breakdown for each section. For the second table the results are:
- Compliant Statements: 7.6%
- Good Attempts: 4.1%
- Partial Statements 8.1%
- Poor Attempts: 46.4%
- No Statements: 33.8%
The third table shows avg WebAIM Million scores for each section. A lower score in this section is better as it denotes less accessibility issues. For the third table the results are:
- Compliant Statements: 177,416.36
- Good Attempt: 240,186.13
- Partial Statements: 189,407.35
- Poor Attempt: 284,802.08
- No Statements: 394,613.10
The final figure is the overall WebAIM score for all organisations we looked at. The score was 289,703.85.
Local Government
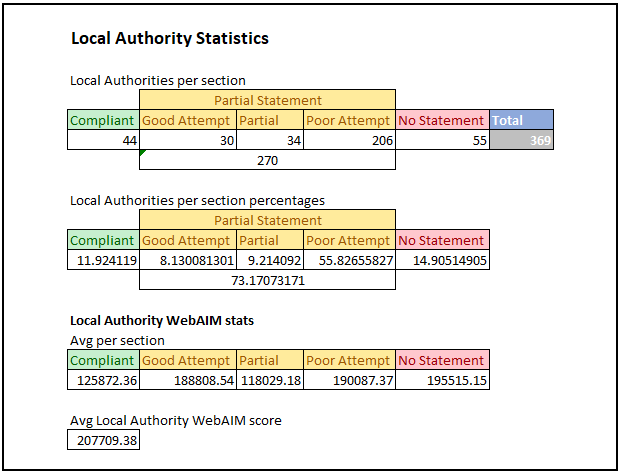
The above tables show statistics for the Local Authorities results of the study. The first table shows number of organisations in each category. For the first table the results are:
- Compliant Statements: 44
- Good Attempt: 30
- Partial Statements: 34
- Poor Attempt: 206
- No Statements: 55
- Total: 369
The second table shows the percentage breakdown for each section. For the second table the results are:
- Compliant Statements: 11.9%
- Good Attempts: 8.1%
- Partial Statements 9.2%
- Poor Attempts: 55.8%
- No Statements: 14.9%
The third table shows avg WebAIM Million scores for each section. A lower score in this section is better as it denotes less accessibility issues. For the third table the results are:
- Compliant Statements: 125,872.36
- Good Attempt: 188,808.54
- Partial Statements: 118,029.18
- Poor Attempt: 190,087.37
- No Statements: 195,515.15
The final figure is the overall WebAIM score for Local Authorities I looked at. The score was 207,709.38.
Universities
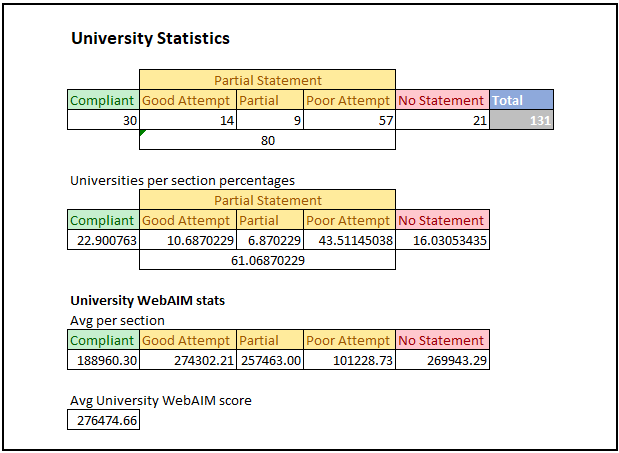
The above tables show statistics for the Universities results of the study. The first table shows number of organisations in each category. For the first table the results are:
- Compliant Statements: 30
- Good Attempt: 14
- Partial Statements: 9
- Poor Attempt: 57
- No Statements: 21
- Total: 131
The second table shows the percentage breakdown for each section. For the second table the results are:
- Compliant Statements: 22.9%
- Good Attempts: 10.7%
- Partial Statements 6.9%
- Poor Attempts: 43.5%
- No Statements: 16.0%
The third table shows avg WebAIM Million scores for each section. A lower score in this section is better as it denotes less accessibility issues. For the third table the results are:
- Compliant Statements: 188,960.30
- Good Attempt: 274,302.21
- Partial Statements: 257,463.00
- Poor Attempt: 101,228.73
- No Statements: 269,943.29
The final figure is the overall WebAIM score for Universities I looked at. The score was 276,474.66.
Police Forces
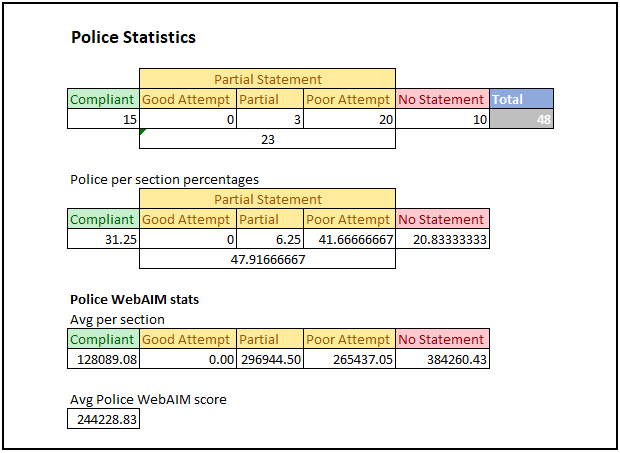
The above tables show statistics for the Police Forces results of the study. The first table shows number of organisations in each category. For the first table the results are:
- Compliant Statements: 15
- Good Attempt: 0
- Partial Statements: 3
- Poor Attempt: 20
- No Statements: 10
- Total: 48
The second table shows the percentage breakdown for each section. For the second table the results are:
- Compliant Statements: 31.25%
- Good Attempts: 0%
- Partial Statements 6.25%
- Poor Attempts: 41.7%
- No Statements: 20.8%
The third table shows avg WebAIM Million scores for each section. A lower score in this section is better as it denotes less accessibility issues. For the third table the results are:
- Compliant Statements: 128,089.08
- Good Attempt: 0
- Partial Statements: 296,944.50
- Poor Attempt: 265,437.05
- No Statements: 384,260.43
The final figure is the overall WebAIM score for Police Forces I looked at. The score was 244,228.83.
Fire & Rescue Services
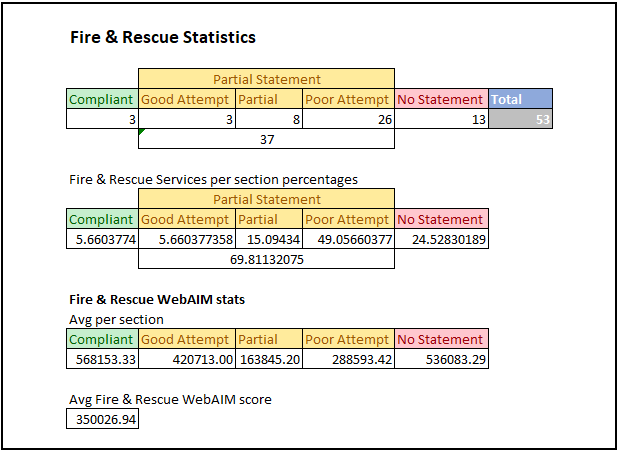
The above tables show statistics for the Fire & Rescue Services results of the study. The first table shows number of organisations in each category. For the first table the results are:
- Compliant Statements: 3
- Good Attempt: 3
- Partial Statements: 8
- Poor Attempt: 26
- No Statements: 13
- Total: 53
The second table shows the percentage breakdown for each section. For the second table the results are:
- Compliant Statements: 5.7%
- Good Attempts: 5.7%
- Partial Statements 15.1%
- Poor Attempts: 49.1%
- No Statements: 24.1%
The third table shows avg WebAIM Million scores for each section. A lower score in this section is better as it denotes less accessibility issues. For the third table the results are:
- Compliant Statements: 568,153.33
- Good Attempt: 420,713.00
- Partial Statements: 163,845.20
- Poor Attempt: 288,593.42
- No Statements: 536,083.29
The final figure is the overall WebAIM score for Fire & Rescue Services I looked at. The score was 350,026.94.
Colleges
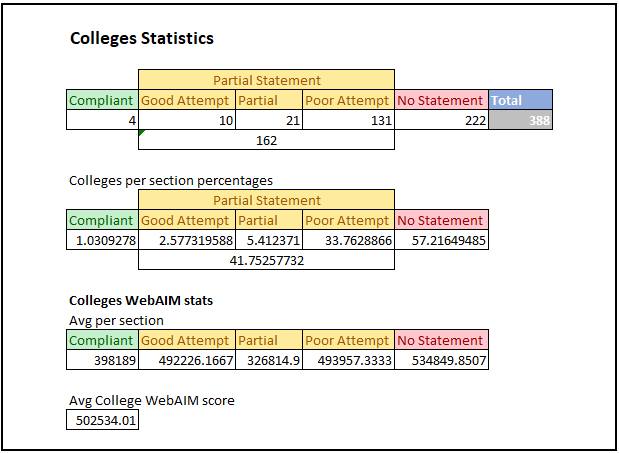
The above tables show statistics for the Colleges of the study. The first table shows number of organisations in each category. For the first table the results are:
- Compliant Statements: 4
- Good Attempt: 10
- Partial Statements: 21
- Poor Attempt: 131
- No Statements: 222
- Total: 388
The second table shows the percentage breakdown for each section. For the second table the results are:
- Compliant Statements: 1.0%
- Good Attempts: 2.6%
- Partial Statements 5.4%
- Poor Attempts: 33.8%
- No Statements: 57.2%
The third table shows avg WebAIM Million scores for each section. A lower score in this section is better as it denotes less accessibility issues. For the third table the results are:
- Compliant Statements: 398,189.00
- Good Attempt: 492,226.17
- Partial Statements: 326,814.9
- Poor Attempt: 493,957.33
- No Statements: 534,849.85
The final figure is the overall WebAIM score for Colleges I looked at. The score was 502,534.01.
NHS Organisations
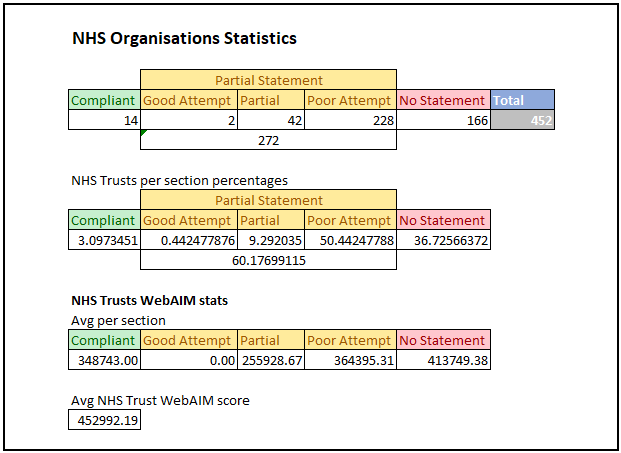
The above tables show statistics for the NHS Organisations results of the study. Covered in the 452 NHS Organisations looked at are:
- NHS Trusts
- NHS CCGs
- NHS Area Teams
- NHS Special Health Authorities
The first table shows number of organisations in each category. For the first table the results are:
- Compliant Statements: 14
- Good Attempt: 2
- Partial Statements: 42
- Poor Attempt: 228
- No Statements: 166
- Total: 452
The second table shows the percentage breakdown for each section. For the second table the results are:
- Compliant Statements: 3.09%
- Good Attempts: 0.4%
- Partial Statements 9.3%
- Poor Attempts: 50.4%
- No Statements: 36.7%
The third table shows avg WebAIM Million scores for each section. A lower score in this section is better as it denotes less accessibility issues. For the third table the results are:
- Compliant Statements: 348,743.00
- Good Attempt: 0
- Partial Statements: 355,938.67
- Poor Attempt: 364,395.31
- No Statements: 413,749.38
The final figure is the overall WebAIM score for NHS Organisations I looked at. The score was 452,992.19.
Observations
Good
- Police are moving to a national template. All services that are now on that template have a compliant accessibility statement seeing Police rise from no compliant statements to 15.
- Significant increase in compliant statements across Local Authorities, Universities and Police since the first round.
Bad
- Fire Services, Colleges and NHS organisations need more focus and support on understanding statements.
- There are several bad examples of statements and some of these are misleading or thoroughly outdated. Some of the common pitfalls are listed below.
Common Pitfalls
- Saying you will specifically not publish a statement.
- Mentions of Netscape support. Netscape as a browser ended in 2008.
- Mentions of WCAG 1.0 which as a standard was superseded in 2008.
- Mentions of the Disability Discrimination Act (DDA) 1995 by organisations across England. The DDA was superseded by the Equality Act 2010 everywhere apart from Northern Ireland.
- Using templates without thorough checking, leading to placeholder information still being included in public statements.
- The claiming of disproportionate burden without significant proof and for work that is arguably not disproportionate. For example; disproportionate burden claims for including a skip to content button, improving alt text on images, or using clear link text.
- Dismissive one liners that intimate that any problems with the website are the issue of the user or their browser.
Other observations
- Across the sectors there is less and less correlation between the presence of an accessibility statement and a better WebAIM score.
Up Next
This is the second iteration of the dataset and I would like to do more with it to further improve the understanding of the UK wide situation. It is a lot of effort for me as an individual to go over all of this information on a regular basis. As such the next review of the existing dataset will be between February and April 2020. This will coincide with WebAIM Million expected score updates and be in time to support the beginning of the GDS active monitoring process.
In the meantime I may be continuing to develop this research, adding more organisations to the list and posting updates when new information is ready.
Sources
For this research I used a number of sources to develop the dataset. For each of the groups I had to find organisational lists. The ones we used are:
- Local Authorities – LGA list of Local Authorities
- Universities – The complete university guide league tables
- Police Forces – Police.UK list of forces
- Fire & Rescue Services – National Fire Chiefs list of Services
- Colleges – Further Education Finder
- NHS Organisations – NHS Service Directory
For our WebAIM Million results we used the WebAIM Million search tool.
The rest of the results were delivered by manually looking at all of the organisations websites.
Get In Touch
This research is not perfect and was completed as a personal endeavour that I gladly share publicly in the hope that it can prove useful to improving accessibility across the UK Public Sector. This work was not commissioned in any way and is not reflective of any organisations’ or individuals’ views on any organisations’ approach to accessibility or regulatory compliance. I fully expect this work to grow outdated quickly as more organisations publish statements.
If you find something in the research that is not quite right I would love to improve so please get in touch using our contact form.
Find Out More
Are you interested in Accessibility Statements? You can find out more along with links to relevant GDS guidance and other organisation’s templates on our Accessibility Statements Page.
If you want to find out more about Digital Accessibility as a wider topic with resources to help you and your organisation improve your accessibility, take a look at our Digital Accessibility Toolkit.